Bitcoin Market Analysis — 27 March 2026
Share this report
Bitcoin (BTC/USD) — Institutional-Grade Market Analysis
Report Generated: 2026-03-27 13:00 UTC
Data Sources: Kraken (OHLCV, Order Book), OKX (Derivatives), Alternative.me (Fear & Greed), CoinDesk Markets, SoSoValue (ETF Flows)
1. Executive Snapshot
| Metric | Value | Signal |
|---|---|---|
| Price | $66,573.10 | -3.21% today |
| 24h High / Low | $69,830 / $66,214 | Range: $3,616 |
| 24h Volume | $2,795 BTC (Kraken) | VWAP: $68,287 |
| ATR(14) | $2,630 | Elevated volatility |
| Fear & Greed | 13 (Extreme Fear) | Contrarian Bullish signal |
| RSI(14) Daily | 39.6 | Approaching oversold |
| RSI(14) Hourly | ~18 | Deeply oversold (1H) |
| MACD (Daily) | Bearish crossover | MACD < Signal line |
| EMA Trend | Bearish | Price below EMA9/21/50 |
| Funding Rate | -0.004597% | Slightly negative — shorts paying |
| L/S Ratio | 1.840 | Long squeeze risk elevated |
| Bid/Ask Ratio | 0.191 | Heavily ask-heavy (selling pressure) |
| Spread | $0.10 | Tight — liquid market |
| 24h Liquidations | ~$300M longs / $50M shorts | Crowded long unwind |
| ETF Flows (Thu) | -$171.12M | Largest outflow in 3 weeks |
| ETF Flows (March) | +$1.53B net | Institutional demand still net positive |
Overall Bias: Bearish short-term / Cautiously Bullish medium-term
2. Technical Analysis
Multi-Timeframe Chart
Daily Timeframe (Primary Trend)
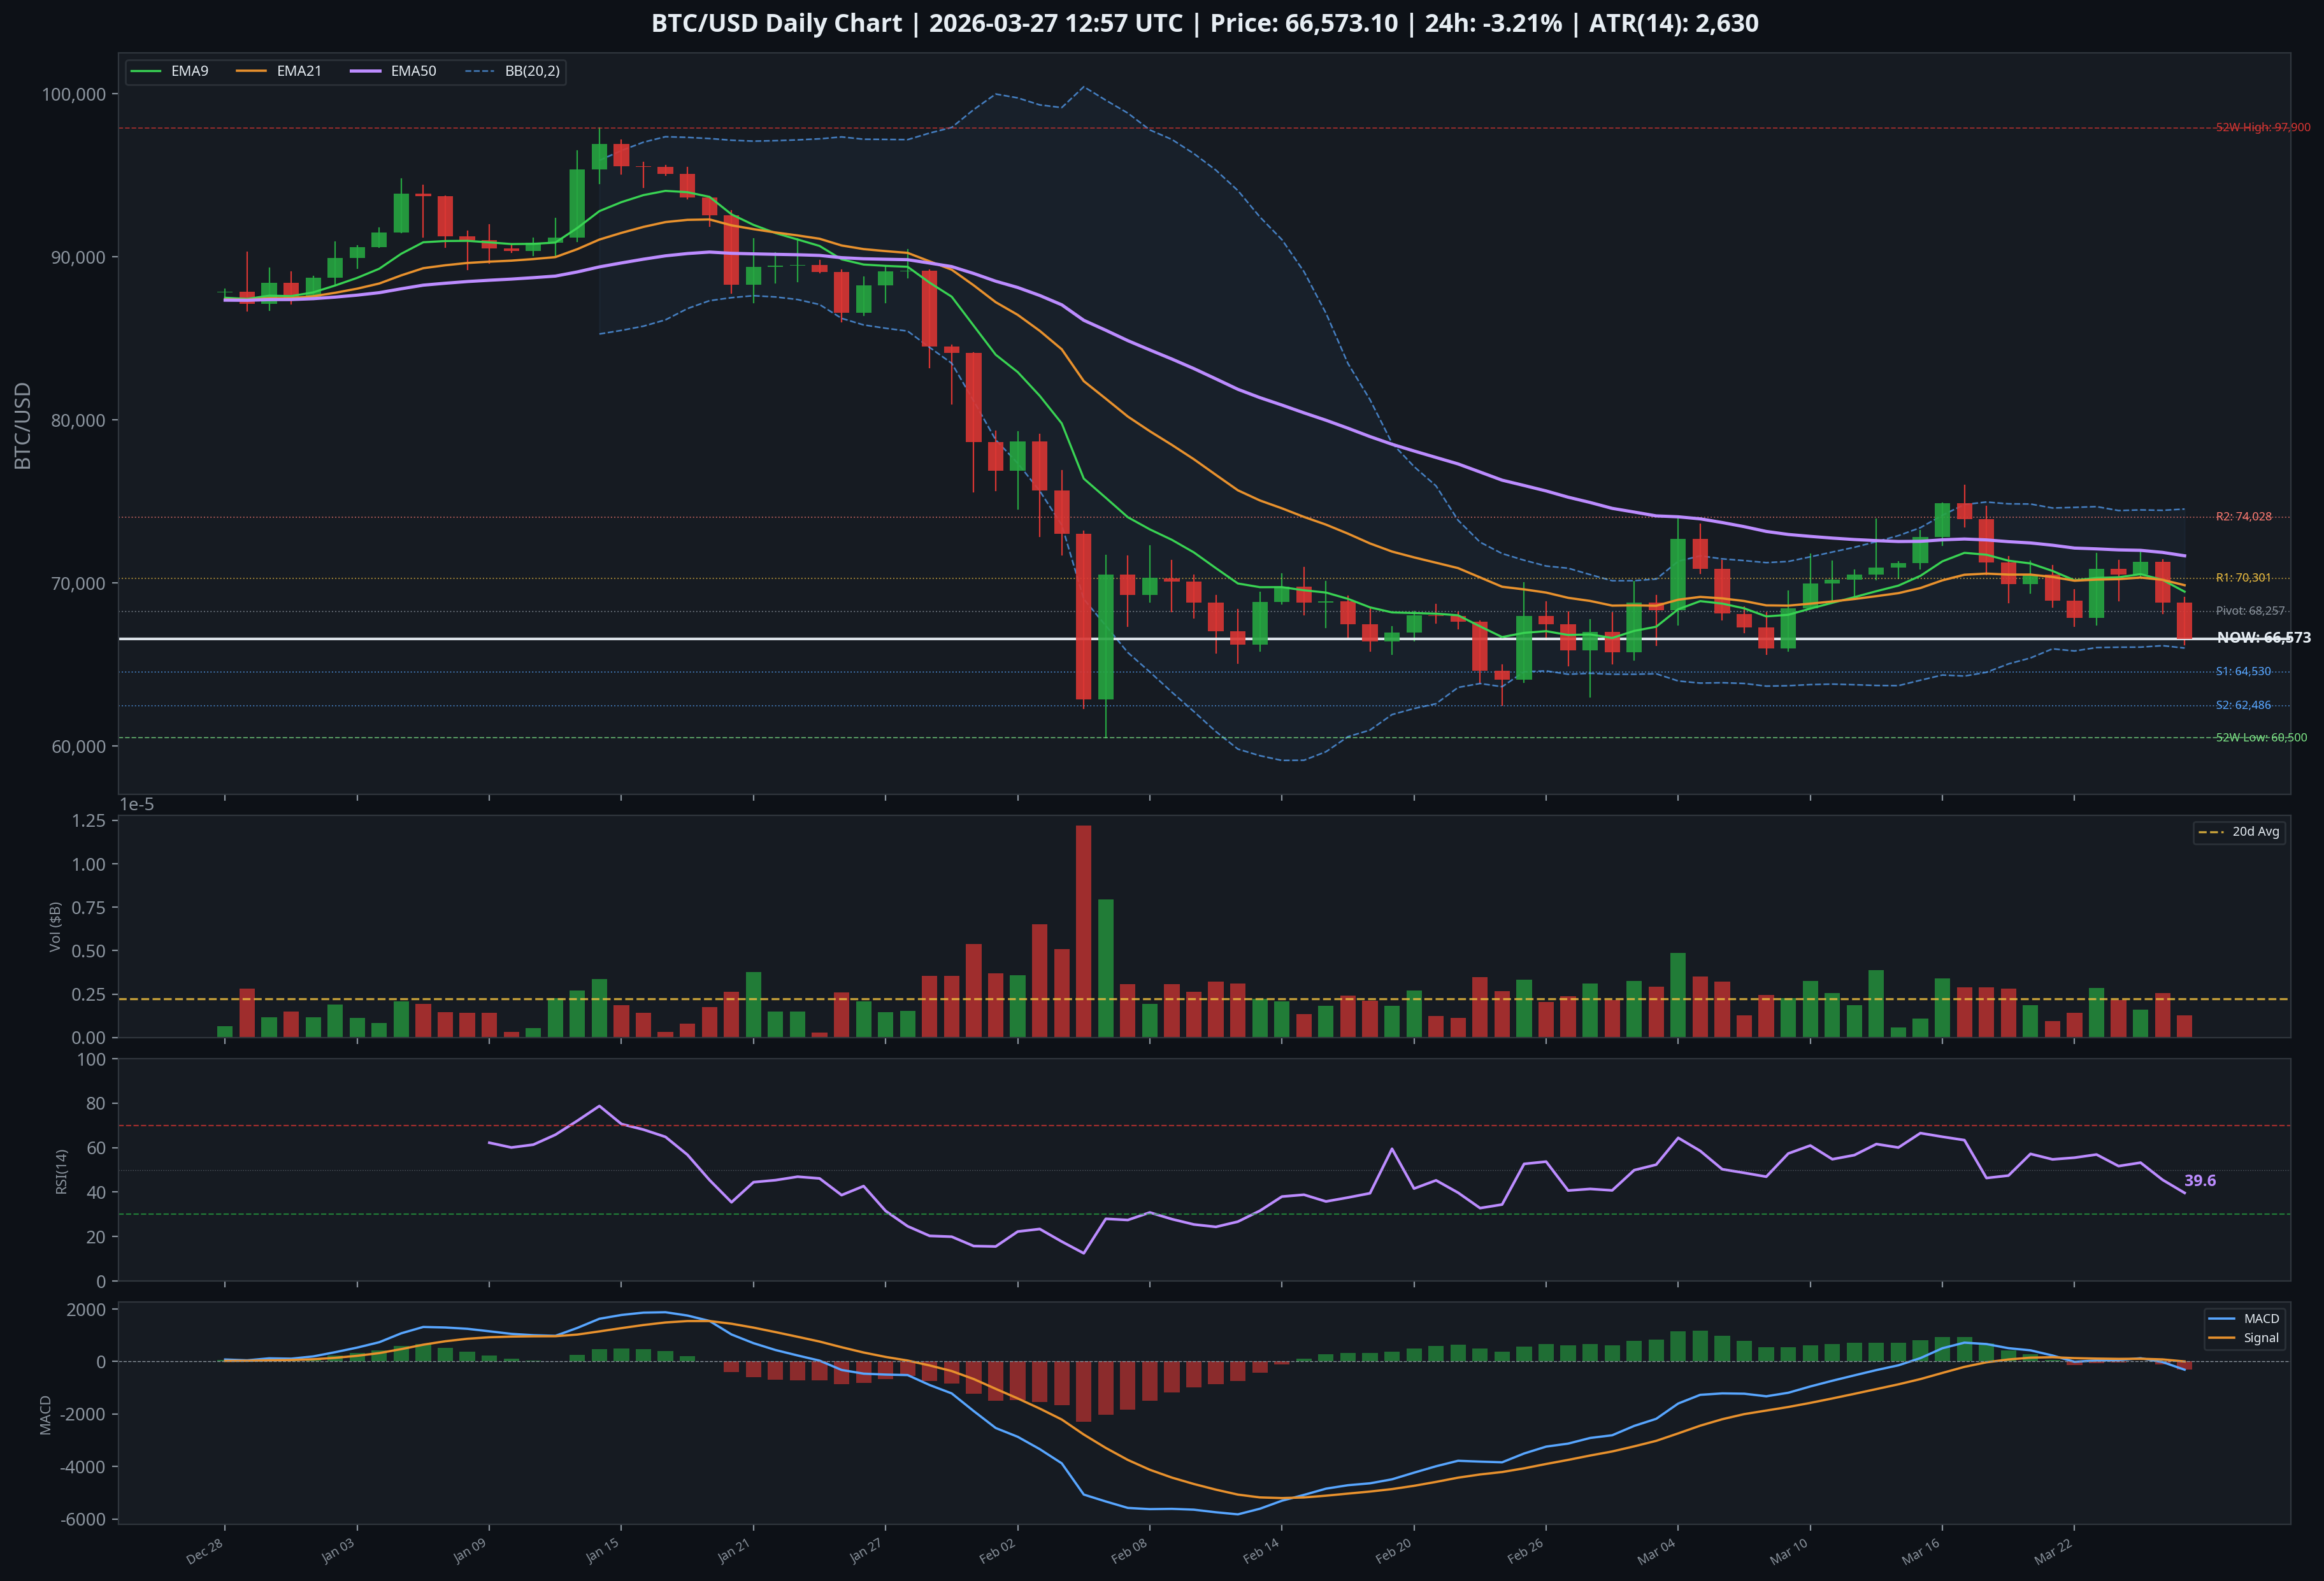
Bitcoin has broken decisively below the $68,257 daily pivot point, confirming the short-term bearish structure that has been building since the rejection from $74,000 resistance on March 18. The daily RSI at 39.6 is approaching the oversold threshold of 30, which has historically acted as a mean-reversion trigger. The MACD histogram is expanding to the downside, indicating accelerating bearish momentum. All three EMAs (9, 21, 50) are fanning out in bearish alignment with price trading below all three — a textbook bearish stack.
The Bollinger Bands are widening significantly, with the lower band now at approximately $64,500, suggesting the current move has room to extend before a statistical mean-reversion. Volume on down days has been above the 20-day average, confirming institutional distribution rather than retail panic alone.
Hourly Timeframe (Short-Term Structure)
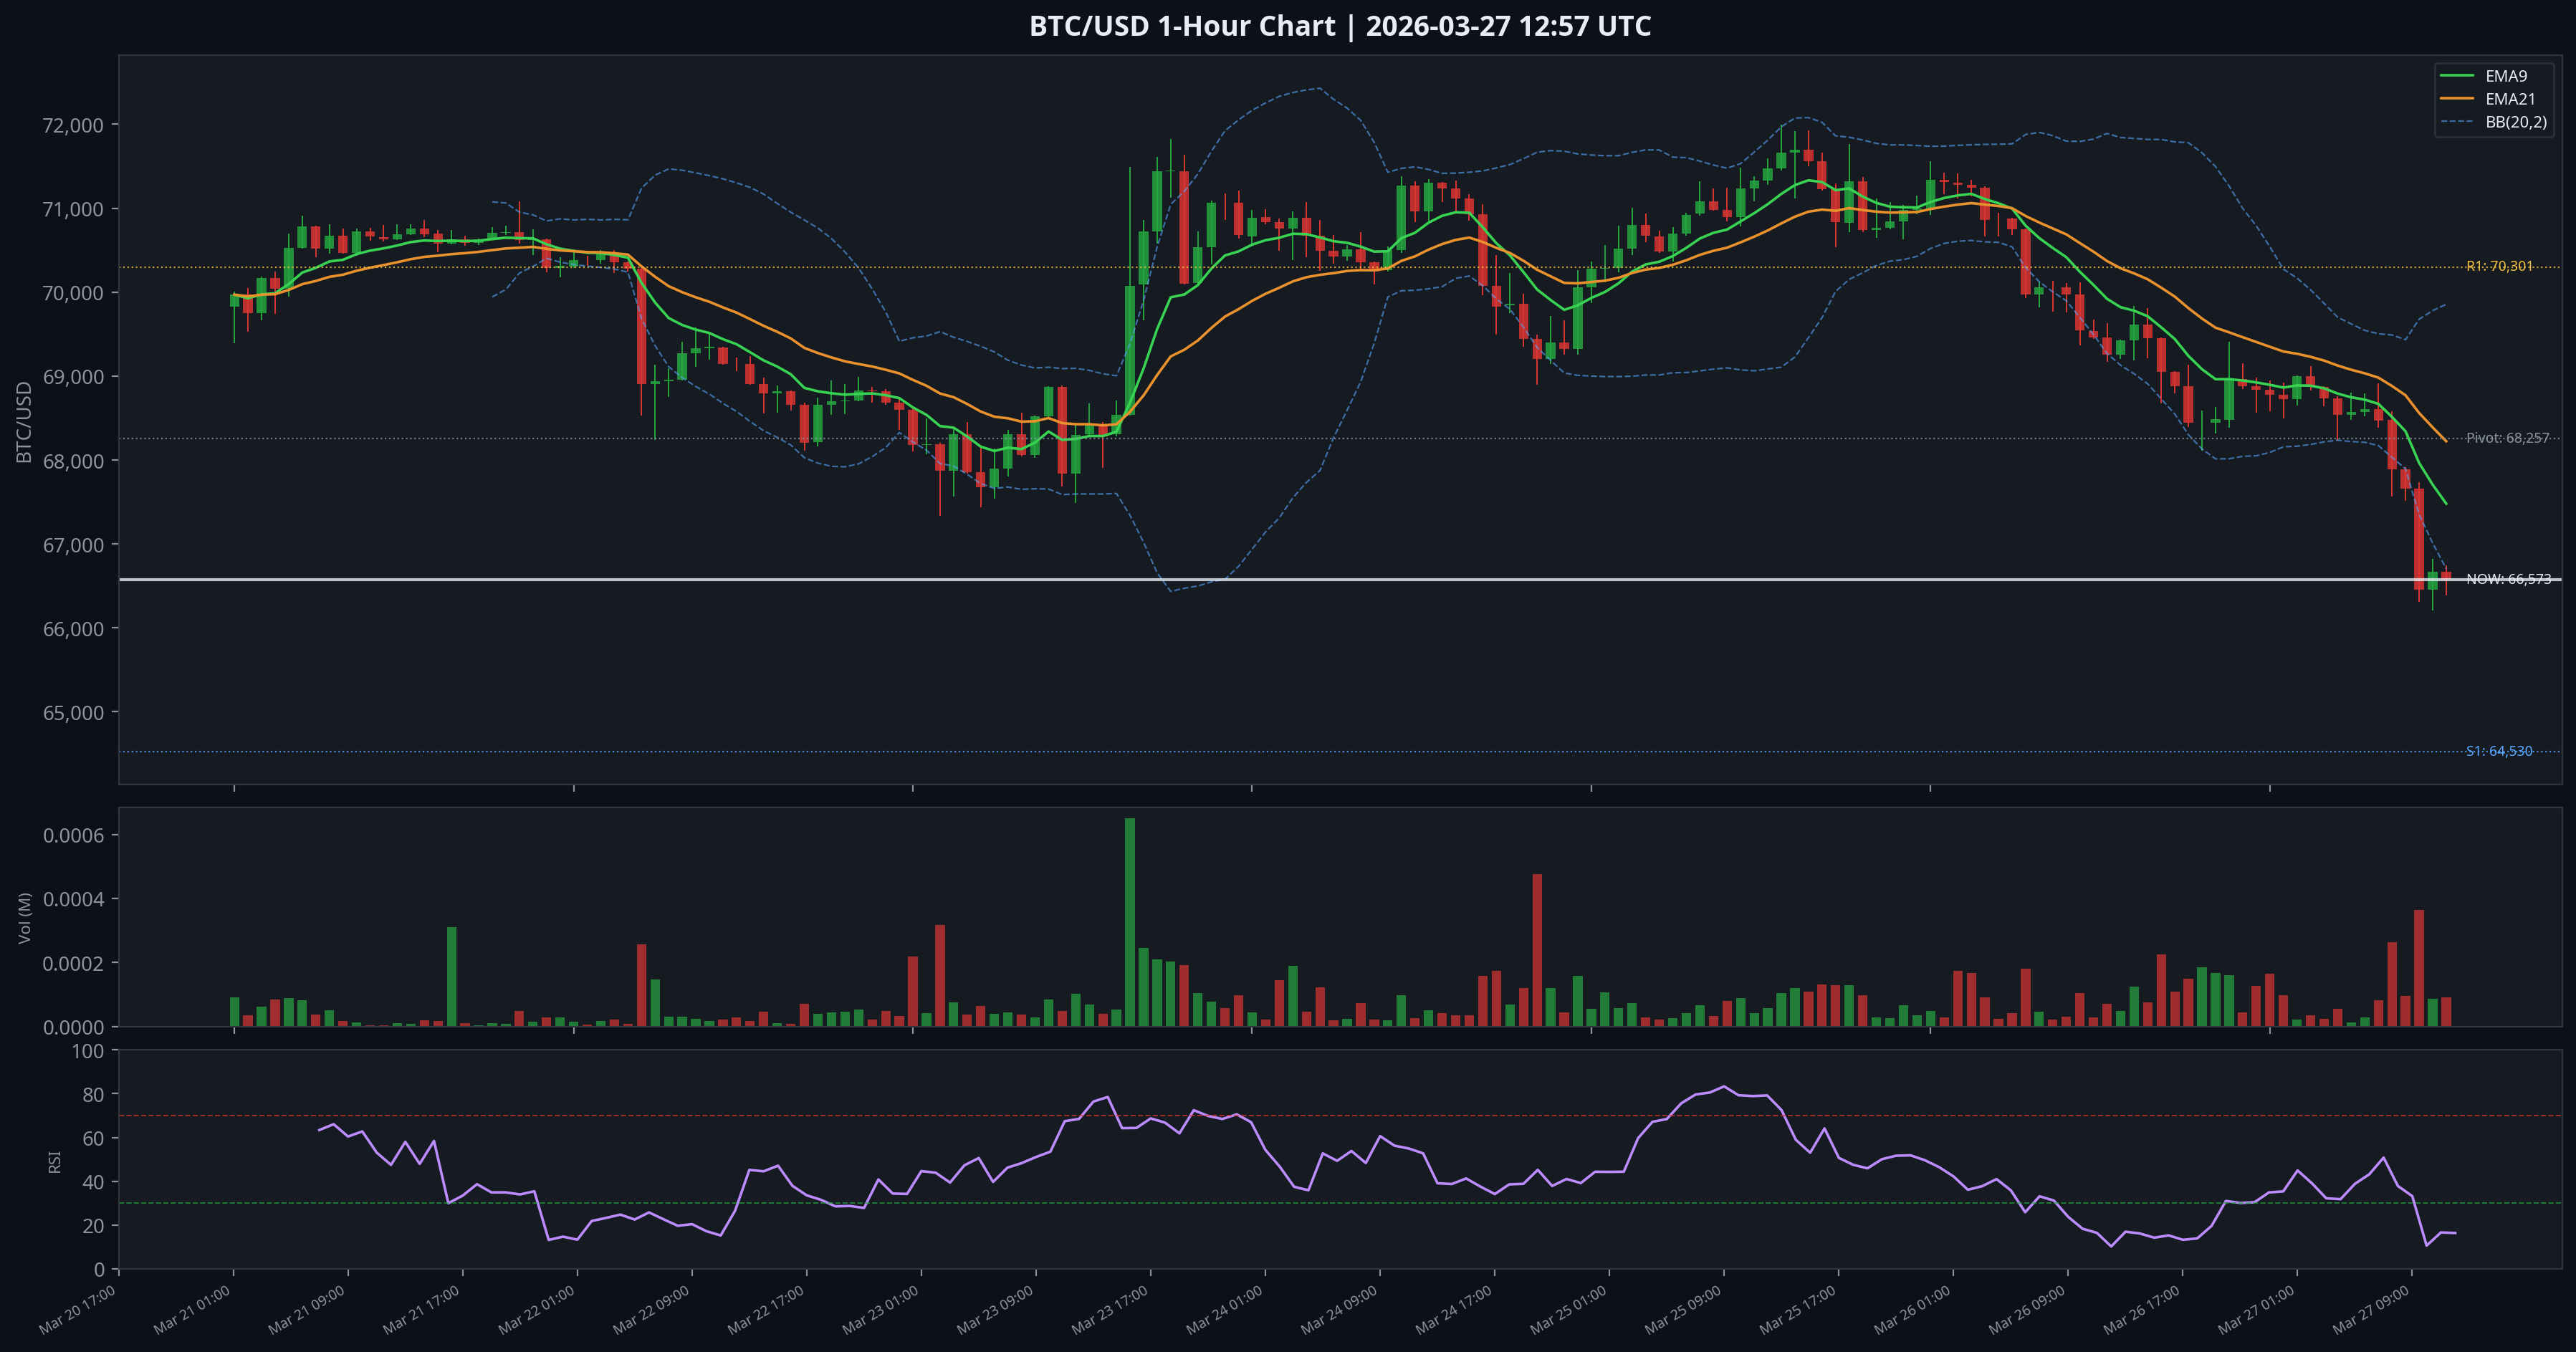
The 1-hour chart shows a sharp acceleration lower beginning around 08:00 UTC, coinciding with the $15 billion in Deribit options expiry and the release of U.S. PCE data. The 1H RSI has reached approximately 18 — deeply oversold territory — which typically precedes at least a short-term bounce. However, oversold conditions can persist in strong downtrends, and the current macro environment (rising oil, Iran war fears, fading Fed cut expectations) argues against a sustained recovery without a catalyst.
Price is now testing the $66,200–$66,500 zone, which represents the lower boundary of the recent 7-day range. A failure to hold this zone opens the door to $64,530 (Pivot S1).
4-Hour Timeframe
The 4H structure shows a clear lower-high, lower-low pattern since March 18. The most recent lower high was formed at $71,100 on March 24, and the current move is testing the March 22 low at approximately $66,200. A breakdown below this level on a 4H close would confirm the bearish trend continuation.
Key Technical Levels
| Level | Price | Type | Notes |
|---|---|---|---|
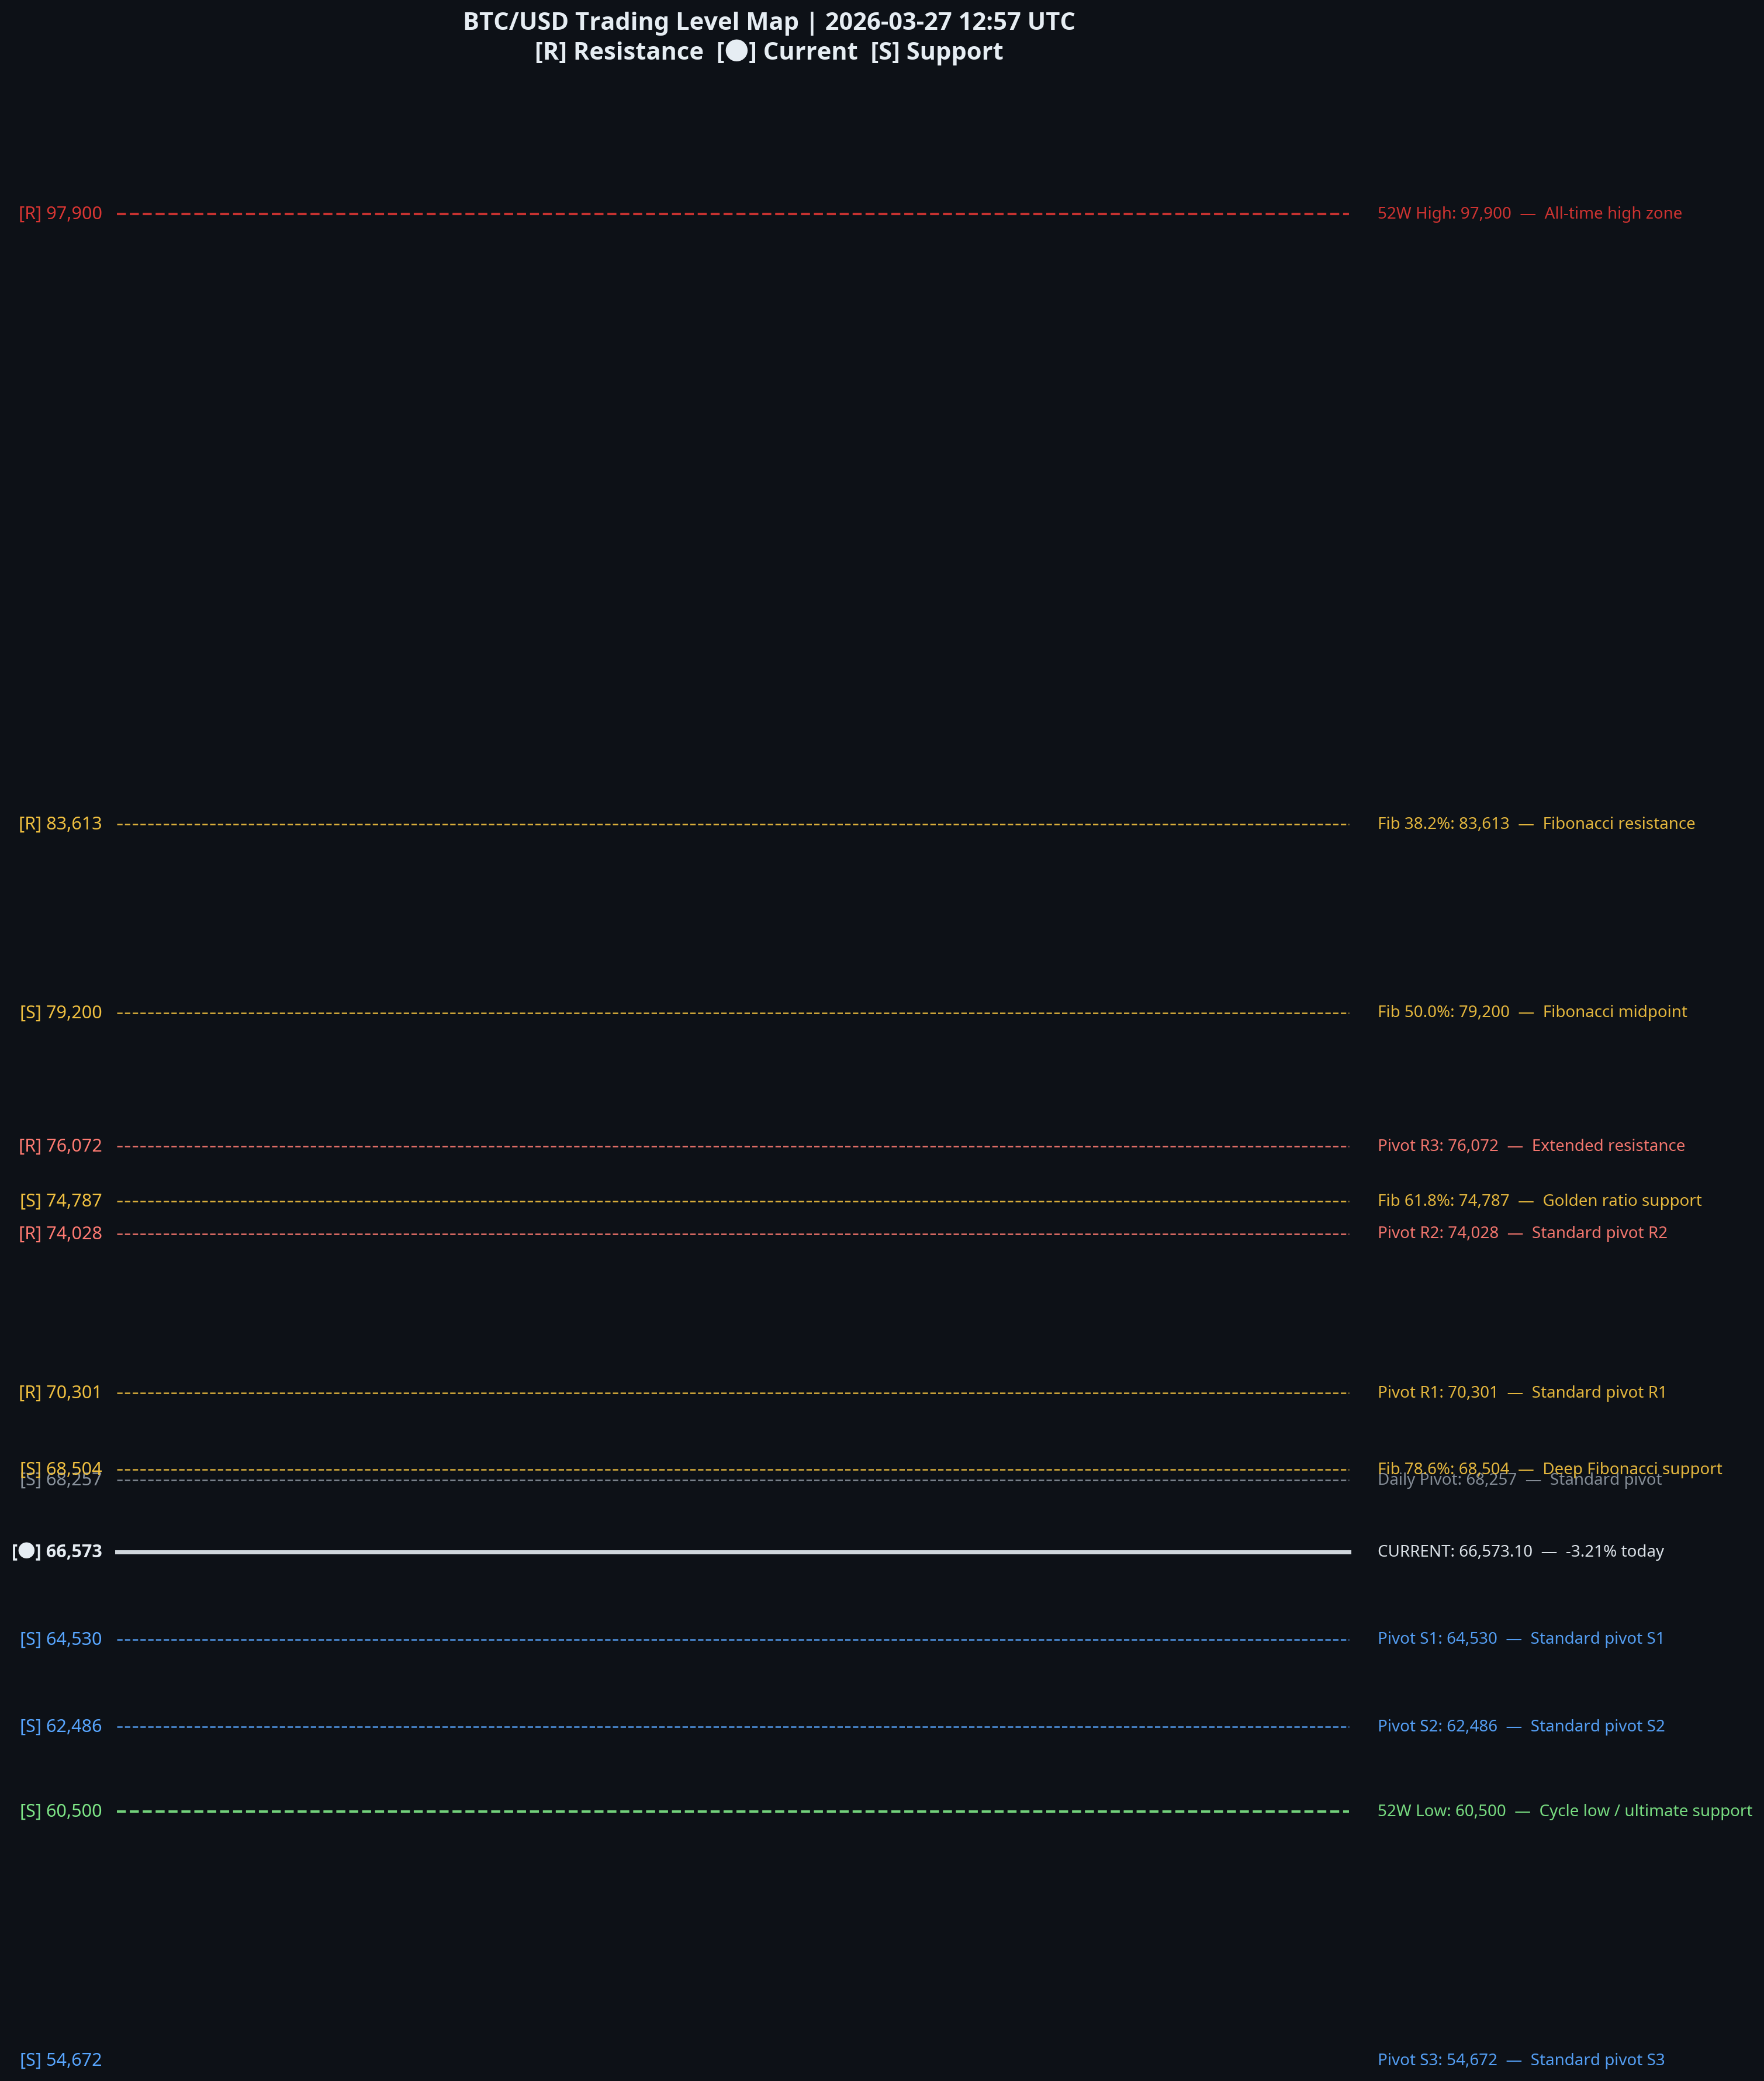
| 52-Week High | $97,900 | Major Resistance | All-time high zone — cycle target |
| Fib 38.2% | $83,613 | Resistance | Fibonacci retracement from ATH |
| Pivot R3 | $76,072 | Resistance | Extended resistance |
| Fib 61.8% (Golden) | $74,787 | Resistance | Golden ratio — key recovery target |
| Pivot R2 | $74,028 | Resistance | Key weekly resistance |
| Pivot R1 | $70,301 | Resistance | Near-term resistance — reclaim needed |
| Daily Pivot | $68,257 | Pivot | Lost today — now acts as resistance |
| Fib 78.6% | $68,504 | Resistance | Deep Fibonacci — confluence with pivot |
| Current Price | $66,573 | Live | -3.21% today |
| Pivot S1 | $64,530 | Support | Near-term support — first target |
| Pivot S2 | $62,486 | Support | Key structural support |
| 52-Week Low | $60,500 | Major Support | Cycle low — ultimate support |
| Pivot S3 | $54,672 | Support | Deep support — black swan zone |
Trading Level Map
Subscribe to unlock the full report — including live order book analysis, derivatives positioning, trading levels, and the complete short-term and long-term trading plans.
Full Report — Subscribers Only
Unlock the complete analysis including live order book depth, derivatives positioning, on-chain metrics, macro catalysts, and the full trading plan with precise entry, target, and stop-loss levels.
Share this report